| A computer system needs to be written down for others to
understand.
Computer systems process data.
One way of representing a system is to use a data
flow diagram.
This type of diagram shows how the data
flows through the system, and what data stores are used. It does not
define what type of data storage is used, or how the data is stored.
this type of detail can be determined at a later stage.
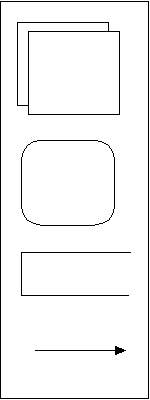
Symbols used :

External Entity -
data source or data destination - ie where
the data comes from or where it goes to...eg timesheet, customer, accountant,etc...
Process -
an operation performed on the data.
Data store -
this could, for example, represent a file
held on disc or magnetic tape, a batch of input documents or a report.
Data flow - the
arrow represents movement of data between entities, processes or data
stores. The arrow should be labelled
to describe what data is involved.
When drawing data flow diagrams, you should stick to the following
conventions:
- do not draw data flow lines directly between data
stores and external
entities. There should be a process
box between them to show the operation performed.
- most processes will have input
data and output
data...so state what they are.
- label all the data flow lines so that it is clear what data is being
transferred.
Example of a Data Flow Diagram
The payroll system in a certain company may be
described as follows:
At the end of each week an employee
hands in a time sheet that is sent to the computer centre showing how
many hours the employee has worked. The employee's data (pay
rates, NI Number etc) is stored on the Employees database and is used to
process the weekly payroll, which produces a payslip that is given to
the employee. The details of the payment are stored in the Accounts
database.
A simple data flow diagram might be as follows:
|